Any selection of lots of food product available to be sampled will have between-lot and within-lot distributions of hazard concentration. The within-lot distribution describes the variety of different concentrations that exist across different samples from within one lot, for example: packages of dry soup mix prepared during one production run, where each package is represented by a concentration in log cfu/g. The between-lot distribution describes the different concentrations across all lots, for example across all production runs in one month, where each production run (lot) is represented by a single concentration: the mean concentration across the product comprising that lot.
The between-lot and within-lot hazard concentration distributions prior to sampling form a baseline against which the effectiveness of the sampling plans are measured.
The tool offers the choice of specifying within-lot distributions that are lognormal, log-uniform, log-triangular, or gamma distributed, whereas the choice for between-lot distributions includes lognormal, log-uniform, log-triangular, and empirical. It is not necessary to use the same type of distribution for both distributions.
i) Lognormal Distribution
A lognormal distribution describes a situation in which some hazard concentrations are extremely low, most are slightly higher than that, and a few are quite high. For example within a lot, some samples of product will have very low concentrations, most will be moderately low, and a few will be quite high. Figure 1 illustrates the shape of the lognormal distribution; the long tail on the right represents the few lots or samples with very high hazard concentration, as measured in colony-forming units (cfu) per gram (or per ml).
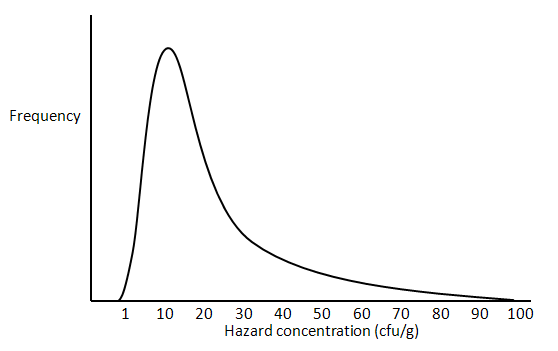
Figure 1 . The lognormal distribution.
When a lognormal distribution is mapped onto a log scale (on the x-axis), it becomes the Normal distribution, whose shape is defined by the mean and standard deviation. Now the units of concentration are log10 cfu/g.
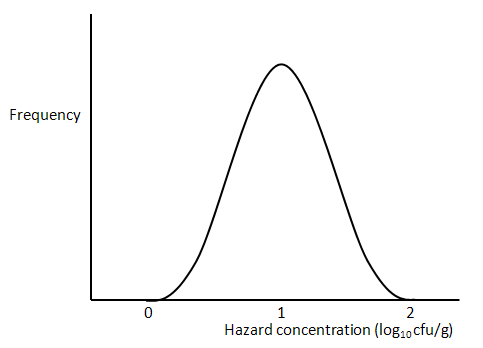
Figure 2 . The normal distribution.
The tool assumes that each lot has an identical within-lot standard deviation so a single value for within-lot standard deviation is sufficient to complete the definition of within-lot contamination.
ii) Uniform Distribution
In the case of the uniform distribution, there is assumed to be an equal number of units (lots or samples of food) having each value of concentration across the specified range. For example, in a uniform within-lot distribution with a range from -3 to 2 log cfu/g, the same number of samples have -3 log cfu/g (0.001 cfu/g) as have -2 or 2 log cfu/g (0.01 or 100 cfu/g), as well as every concentration in between. No samples have less than -3 or more than 2 log cfu/g (Figure 3).
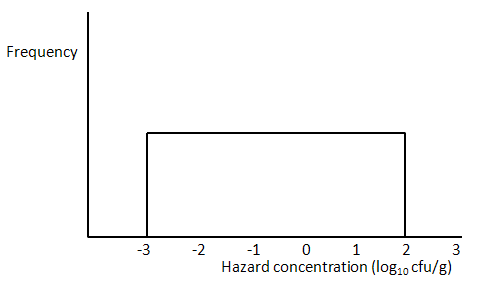
Figure 3 . Uniform distribution of hazard concentrations.
As it applies to lots, the same number of lots would have a mean hazard concentration of -1 log cfu/g as have 0 or 2 log cfu/g, and no lots would have concentrations less than -3 log cfu/g or greater than 2 log cfu/g.
When defining a uniform between-lot concentration distribution, both the minimum and maximum level must be specified (here -3 and 2). However, for a within-lot uniform concentration distribution, it is only necessary to enter the size of the range of values (in this case, 5, being the spread between -3 and 2).
iii) Triangular Distribution
The triangular distribution represents the situation in which the concentration in the middle of the range is the most frequently occurring value, and those at the ends of the range occur least frequently (Figure 4).
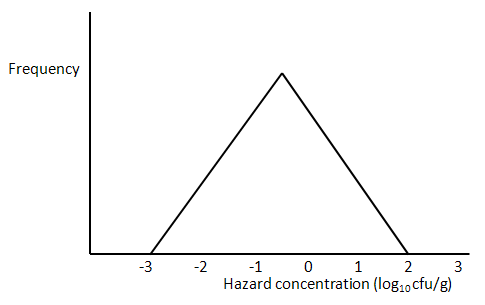
Figure 4 . Triangular distribution of hazard concentrations.
As above, when defining a between-lot concentration distribution as triangular, the minimum, mode and maximum level must be specified (here -3, -0.5, and 2). However, to define a triangular within-lot concentration distribution, it is only necessary to enter the size of the range of values (in this case, 5, being the spread between -3 and 2). For within-lot distributions, the tool assumes that the triangular is symmetrical, i.e. the mode is midway between the minimum and the maximum on the log scale.
iv) Empirical (Cumulative) Distribution
This distribution is available for describing between-lot distributions only. The empirical distribution is defined on a cumulative basis, in other words, for each concentration the distribution reflects the sum of all the probabilities associated with lower concentrations. For example, in the distribution shown in Figure 5, the probability associated with a concentration of -1 log10 cfu/g is 0.9. This means that 90% of all lots have mean concentrations at or below
this level.
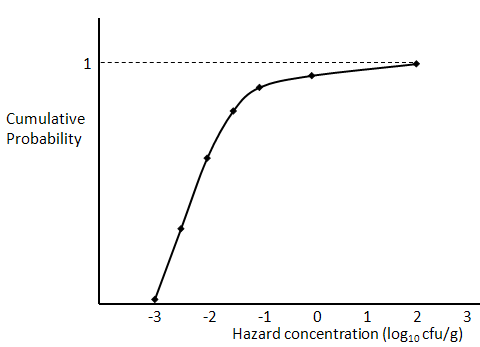
Figure 5 . Empirical (cumulative) distribution of hazard concentrations.
The input required for this distribution is in the form of pairs of probability :concentration values, where the first probability must be 0 and the last must be 1. For the example shown, the input would be:
0, -3
0.3, -2.5
0.6, -2
0.8, -1.5
0.9, -1
0.95, 0
1, 2
These values indicate that no lots exist with a mean hazard concentration of -3 log10 cfu/g or lower, and similarly none exist with a concentration higher than 2 log10 cfu/g, since the probability has already reached 1 by that point and no further increments occur.