|
Measuring the Performance of Sampling Plans
The impact of the types of sampling plans on the safety of a food product can be expressed in various ways. The probability of rejection of individual lots, based on their mean hazard concentration is one way, and this is represented in the Operating Characteristic curve (OC curve). The OC curve represents the impact of a sampling plan at the level of an individual lot, and its points consist of mean within-lot concentrations and their corresponding probability of acceptance (or rejection).
Given a between-lot distribution, the tool can also calculate risk reduction based on the proportion of lots sampled and the fraction of those that are rejected, according to the OC curve. This value assumes that rejected lots are withdrawn from the market.
Operating Characteristic Curve
The Operating Characteristic curve (Figure 1) illustrates the probability of a lot being accepted relative to the mean hazard concentration in the lot. For lots with a low mean hazard concentration the likelihood of acceptance is 1 (100%) or nearly 1, but this likelihood drops as the hazard concentration of the lot increases. Figure 1 indicates that a plan using only 10 samples is associated with a higher likelihood of acceptance at mean hazard concentrations between -2 and 2 log cfu/g than a plan calling for 20 samples.
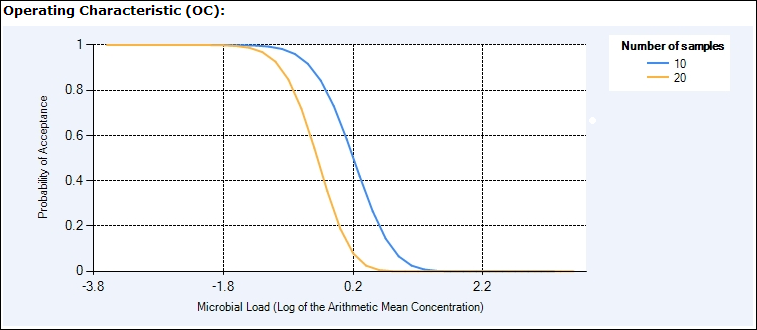
Figure 1 . Operating Characteristic curve. This represents the probability of lot acceptance given a mean hazard concentration.
Detectable Microbial Load at the Target Probability of Rejection
A related metric represents the mean concentration of hazard that will result in the lot being rejected a certain percentage of the time. This percentage is often termed the “Target Probability of Rejection”, and the associated concentration termed the “Detectable Microbial Load” (DML). These can be read off of the OC curve, and for the purposes of this tool each within-lot arithmetic mean concentration can be thought of as a DML, with a certain probability of rejection attached to it.
Assume “Plan 1” has 10 samples and “Plan 2” has 20 samples. According to the OC curve in Figure 1, a lot having a mean hazard concentration of 0.4 log cfu/g will have a 95% likelihood of being rejected under Plan 2 (the "P accept" value is 0.05). In other words when the Target Probability of Rejection is 95%, the DML of Plan 2 is 0.4 log10 cfu/g. Plan 1 is less stringent; under this plan the DML associated with a rejection rate of 95% is higher at approximately 1 log10 cfu/g. This information is of interest to producers or manufacturers who aim to minimize losses due to lot rejection.
Lot Rejection Rate
The Lot Rejection rate is calculated as the “Percentage of Tested Lots Rejected”. In other words, it reflects the impact of the probability of rejection across the range of concentrations making up the between-lot distribution. The Percentage of Tested Lots Rejected therefore determines the amount of product that would be removed from the marketplace as a result of the sampling plan, assuming that lots failing to meet the microbiological criteria are withdrawn.
This value cannot be calculated unless a between-lot distribution has been defined.
Risk Reduction
When a lot of food is rejected and withdrawn from commerce, the number of pathogens that are removed from the food supply is proportional to the arithmetic mean concentration of the lot. Therefore the ratio of the post-sampling mean concentration to the pre-sampling mean concentration, among tested lots, represents the proportion of the load (among tested lots) that has been removed from the market. Meanwhile 100% of the load among untested lots remains in the food supply.
Thus if the arithmetic mean concentration over all lots pre-sampling is -1 (i.e. 0.1 cfu/g), and the concentration post-sampling is -2 (i.e 0.01 cfu/g), then the Proportion of Microbial Load Remaining after sampling would be
0.01/0.1 or 0.1 (10%)
if all lots were tested, but if only 20% of lots were tested it would be
0.8(1) + 0.2(0.1) or 0.82 (82%).
The formula for Percentage of Microbial Load Remaining is
Fraction untested x100% + Fraction tested x (10^post-sampling mean/10^pre-sampling mean)
|