The contamination profile of hazard in and among the lots of food product can be defined by the range or standard deviation of within-lot hazard concentrations, and the mean and range (or standard deviation) of the between-lot distribution. If no between-lot distribution is provided to the tool, the Operating Characteristic curve is the main result. Sensitivity Analysis can be performed, and the tool can find values of specific parameters that will result in defined targets being met. If a between-lot distribution is also defined, the tool can provide risk reduction results, such as the fraction of microbial load remaining after sampling.
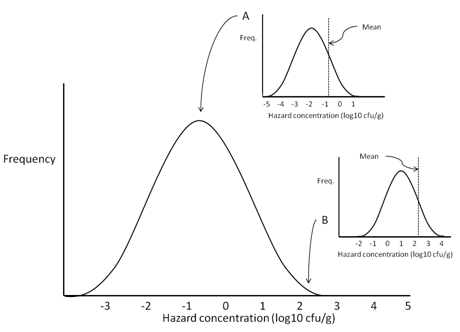
The figure above illustrates the relationship between 2 selected within-lot distributions, and a between-lot distribution. The between lot distribution represents the array of arithmetic mean concentrations of the within-lot distributions, on the log10 scale.
The options for defining within-lot distributions are the lognormal, the log-uniform (hereafter called the uniform), and the log-triangular (hereafter called the triangular).
Similarly, the options for defining between-lot distributions include the lognormal, the uniform, the triangular, and the empirical (or “cumulative”). The empirical is a user-defined cumulative distribution defined by paired values of concentration and cumulative probability.
Although it is assumed that each lot has the same distribution (hence a single range or SD defines all of the within-lot distributions), there is no requirement for the shape of distribution characterizing the within-lot to be the same as that characterizing the between-lot.
REQUIRED INPUTS
For Within-lot distribution:
If lognormal: standard deviation in log10 cfu/g
If uniform: range (max value – min value) in log10 cfu/g
If triangular: range (max value – min value) in log10 cfu/g
Note that a mean is not required to define the within-lot distribution for the purposes of this tool. The Operating Characteristic curve that the tool produces provides the probability of acceptance for every possible hazard concentration.
Note also that for the within-lot distribution, the tool assumes that the triangular distribution is symmetrical on the log10 scale, so no mode value is required.
For Between-lot distribution:
If lognormal: mean and standard deviation in log10 cfu/g
If uniform: minimum and maximum values (of mean within-lot concentrations) in log10 cfu/g
If triangular: minimum, mode, and maximum values (of mean within-lot concentrations) in log10 cfu/g
If empirical: pairs of concentration/cumulative probability values, where the concentration is in log10 cfu/g, and the probability is 0 for the first concentration and 1 for the last.